
Asia-Pacific E-Resilience Toolkit Tool
South Asia Drought Monitoring System
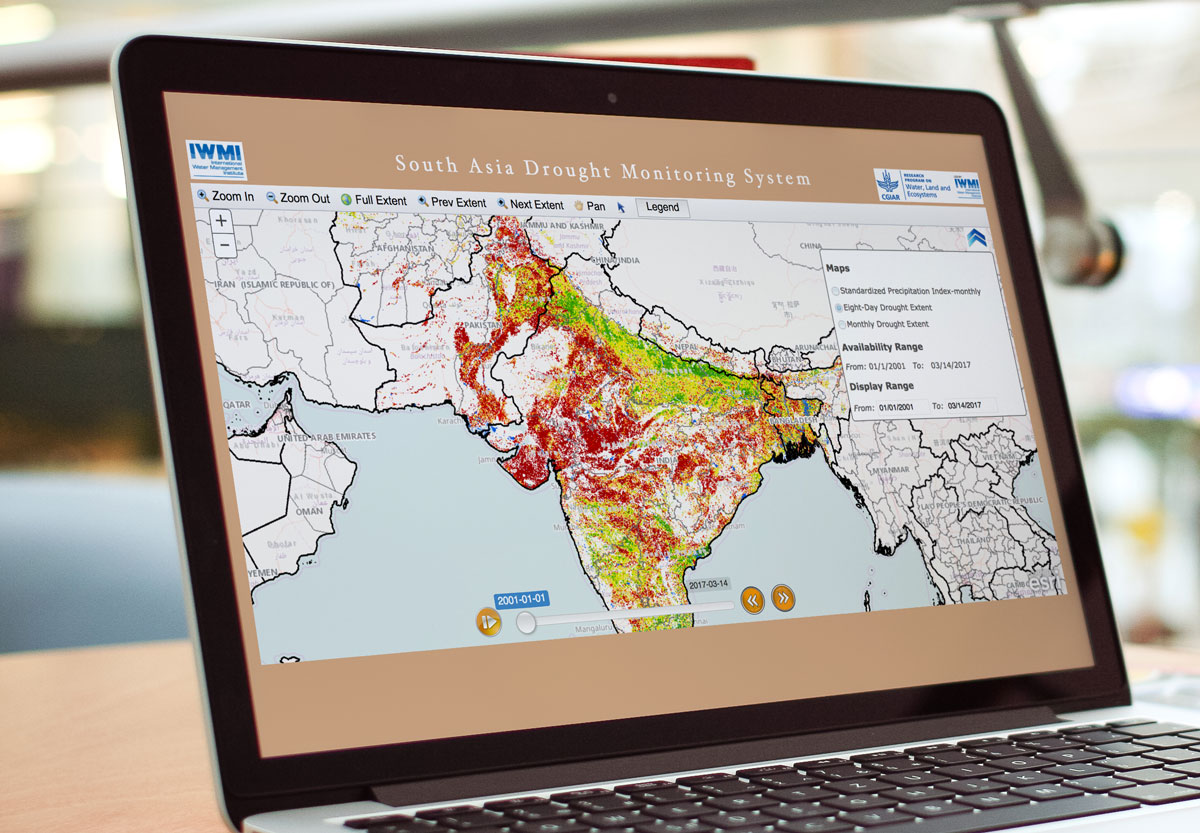
The South Asia Drought Monitoring System (SADMS) was established in 2014 and provides weekly maps that reflects drought conditions in South Asia. The system uses numerous drought indices, including the Integrated Drought severity Index and Soil Moisture Index, to monitor and assess drought conditions. The system and its outcomes are imperative to decision-making process.
In particular, drought conditions have a negative impact on agriculture. Though the South Asia Drought Monitoring System, IWMI could monitor drought’s impact on agriculture. Through the SADMS website, IWMI garnered the freely available satellite imagery to improve drought monitoring and drought prediction.
Through the South Asia Drought Monitoring Systems, policymakers and relevant stakeholders are able to:
- Explore the spatial condition of ground vegetation throughout south Asia region, at the level of specific districts in respective countries and at the level of specific pixels of 0.5 by 0.5 km. The default spatial image shows the distribution of drought condition over a district, sub-district administrative boundaries if any exist and some landmarks, including rivers/canals, roads and or settlements. A similar approach is followed for other drought indices.
- The Integrated Drought Severity Index (IDSI) calculations integrate satellite-based observations of vegetation conditions and climate data and other biophysical information such as land cover/land use type, topography and river basin details.
- Create the on-line time-series graphs of drought-related vegetation characteristics and study the deviation of those from the long-term mean for a district or pixel. The graphs can be built for a time period selected by the user, allowing the developing deficits of vegetation density and vigor to be detected and quantified on-line. Once the district is selected on the front page of the DMS, the default time series graph appears showing the long-term average Vegetation Condition Index (VCI), Temperature Condition Index (TCI), Precipitation Condition Index (PCI) and the current VCI, TCI and PCI time series. The start of the plotting period can be interactively selected at this point and the time series graph re-plotted. Similarly, other indices can be examined at this stage by clicking the appropriate link on the screen and accessing the on-line database.
- Download images of drought indices “IDSI” or “SPI” for South Asia for inclusion in various reports or presentations. These images may be previewed before downloading.